Relocation
Moving From San Francisco or the Peninsula to Danville: What 200 Sales Show
Moving from San Francisco or the Peninsula to Danville usually means trading citywide walkability for space, then choosing carefully among neighborhoods with very different access to downtown, trails and daily errands.
Across 200 other detached Danville sales that closed in the year to October 5, 2026, the median home sold for $1,800,000. It had 2,192 square feet on a 10,994-square-foot lot and went pending in 13 days. Among the 193 sales with a usable offer count, the median was two offers. Competition was common; five-offer bidding wars were not.
Once the budget is workable, the harder decisions are which kind of walkability you actually want, how much single-story living is worth to you, and how your offer strategy should change by property and by market period. (Jens Hansen's own MLS export; methodology below.)
How do you decide whether moving from San Francisco to Danville will make your life better?
Start with the thing a listing cannot tell you.
On relocation tours I add a row to every tour sheet, under square footage and lot size and the state of the primary suite, scored one to five:
Daily-life fit — Can you picture your normal week working here?
Six homes in a day, the same row on all six. It produces better conversations than a neighborhood score does, because it forces specifics. Is there somewhere within walking distance you would actually go? What does the commute become? Is an older close-in house worth more to you than a newer one further out?
Those answers move more than budget does. In my experience the price ceiling tends to hold while the order of priorities reshuffles, and that reshuffling is the real work of a relocation search.
I also represented the buyers at 559 Old Orchard, which closed for exactly $2,000,000. That sale is held out of every figure below, so this page compares one transaction against an independent set of peers rather than against itself.
What is it actually like to move to Danville and raise a family?
I can only answer this one way, which is from my own house.
We came out from San Francisco in 2017, before we had kids. Almost ten years later we do not miss the city and we do not miss the Peninsula. We made friends. Our kids made friends. The weather is better than people expect, the restaurants are better than people expect, and Tahoe and Napa are close enough to be ordinary weekends rather than trips.
My old pitching coach used to tell me, I'm never gonna ask you to do something that I wouldn't do myself. I've carried that into this job. I'm living proof of what life could be like, but that doesn't mean it's gonna be the best fit for you. I can try to answer enough questions that you make the right decision for your family. I'm not here to convince anyone to move to Danville.
Are there areas of Danville where walkability is possible, to replicate what I liked about SF?
Yes, in several neighborhoods, and the first thing to settle is what you mean by the word.
Danville is not as walkable as San Francisco, and it is not going to be. But two different questions hide inside the word, and they point at different parts of town.
Do you want to walk to something? Westside Danville is the one everyone names: downtown, single-story homes, flat lots. In my current experience showing there it trades at a premium and is tough to find under $3 million — that is a working observation from the market I am in, not something the dataset below measures. Most of the buyers I work with are somewhere between $1.8 and $2.4 million. Other neighborhoods where walking to downtown is realistic: Woodbine, Diablo West, Sycamore, Leander Hills, El Pintado, Las Lomitas, Woodmont and Camino Verde.
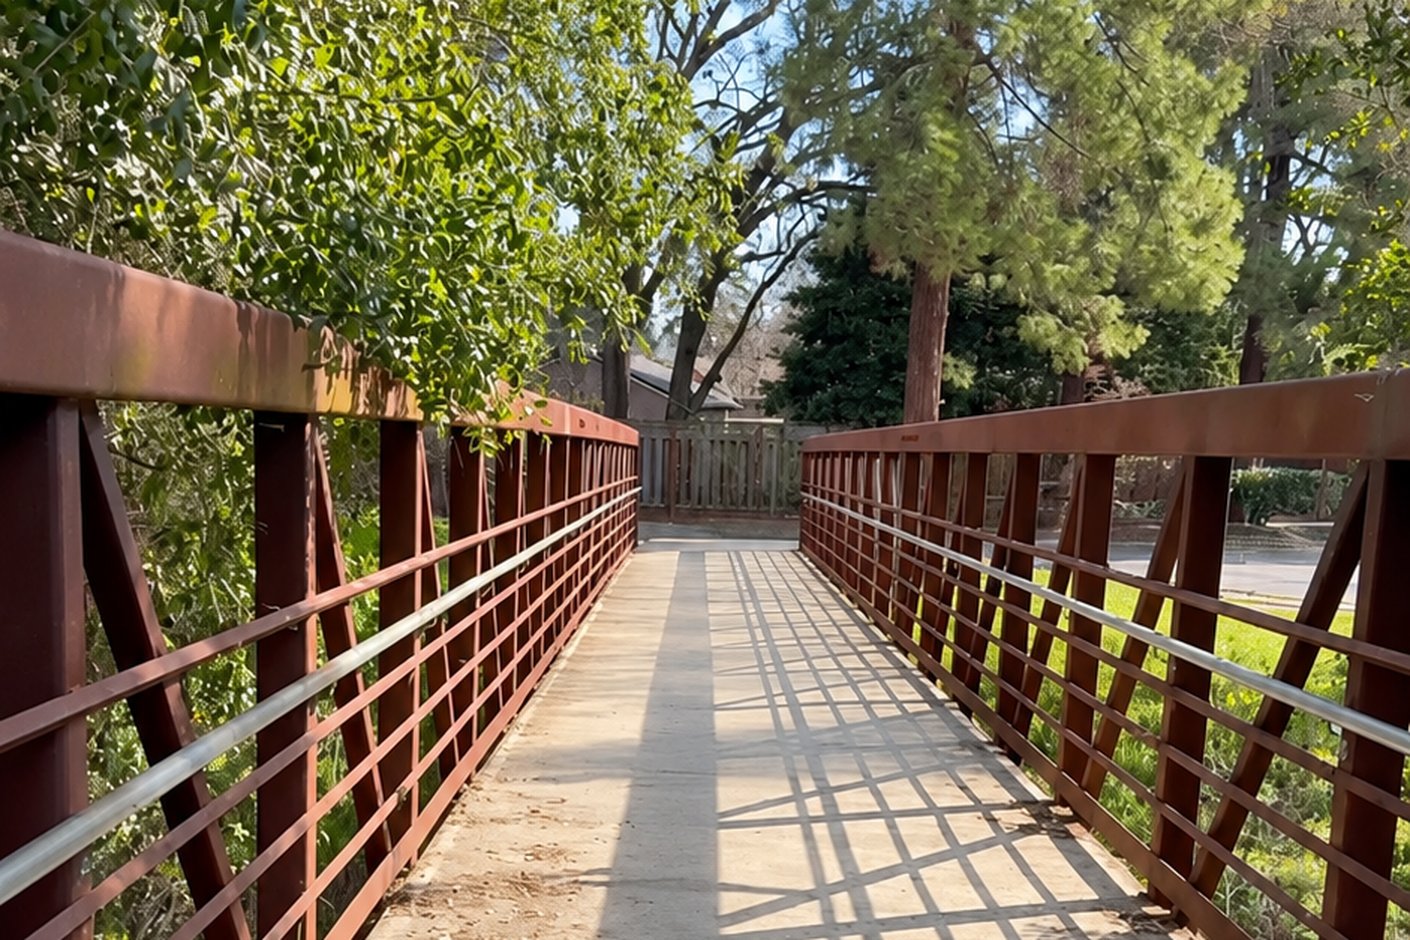
I live in Woodbine, and walkability was the reason. A shortcut bridge out of the neighborhood drops you onto Diablo Road, and downtown is about a fifteen-minute walk from there. On a good Saturday the girls get their scooters and we walk down for coffee and the farmers market. We can walk our kids to school in about twelve minutes. That set of things is why we picked this street.
A fair warning about what I can and cannot tell you. I can tell you how long a walk takes, what a street is like on a Saturday morning, how the housing stock ages as you move toward downtown, and what the numbers below say. What I will not do is characterize who lives in a neighborhood or tell you where you would fit in. Those are not mine to assess, and the useful version of the question is observable anyway: the walk, the commute, the lot, the errands you would actually run.
Or do you just want to walk? Different requirement, and it opens up far more of the town. Anderson Ranch, off Camino Tassajara, has wide streets and real sidewalks, plus trails along Camino Tassajara itself: a thirty-minute loop with a dog and never a shoulder. Greenbrook and Danville Station walk to Osage Station Park and onto the Iron Horse Trail, though downtown along the trail is thirty-five to forty minutes from there. Diablo Hacienda sits within a mile of all three schools, and downtown on foot is not realistic.
The Iron Horse Trail earns its reputation and it is more a weekend thing than a daily one. Long stretches are shaded, which matters in August. Plenty of people who cannot walk downtown drive to the farmers market and ride the trail instead. It is managed by the East Bay Regional Park District, whose Iron Horse Regional Trail page carries the current maps, staging areas and closure notices; the Town of Danville's Community Parks page lists park locations, including Osage Station Park.
What walkability tends to cost here: age. The close-in neighborhoods often have older housing stock, frequently 1960s and 1970s. Much of the 1980s and 1990s construction sits further out along Camino Tassajara. And the further out you go, the more the 680 commute becomes part of the conversation.
So before you shortlist a neighborhood: walk to a coffee shop, or a trailhead? Walk to school? Walk the dog for thirty minutes without thinking about it? Those are different answers and they do not live in the same part of Danville.
Do single-story homes command a price premium in Danville?
In this trailing-year sample, single-level homes were associated with about 9% higher prices than comparable two-story homes. That was the most surprising thing in the data.
Buyers from the city often arrive with no view on this and develop a strong one halfway through, so I tested it. Comparing raw medians would mislead, because single-story homes here are smaller and price per square foot rises as homes shrink. So I fit a model across those sales holding square footage, lot size, age, bedrooms, bathrooms, a private pool, garage spaces, neighborhood and the quarter the offer was accepted constant, and estimated the adjusted association between single-level construction and sale price.
The answer: after controlling for size, lot size, age, bedrooms, bathrooms, pool, garage, the quarter the offer was accepted and a coarse neighborhood grouping, one-story homes were associated with roughly 9% higher sale prices than two-story homes. A second method that down-weights unusual sales instead of trusting them fully puts it at 8.5%.
Then I tried to break it, and it held: trimming the largest and smallest homes, trimming the highest and lowest prices, and removing the neighborhood and timing controls one at a time all left the association in the same range. The harshest test deletes the sixteen observations flagged as influential by Cook's distance, which drops the estimate to 6.4%; I checked all sixteen and none is a data error, so that is a sensitivity test rather than a correction. The direction is consistent everywhere. The exact magnitude is not pinned down. Full confidence intervals are in the methodology.
Four honest limits. This is one year in one town, so treat it as a local pattern rather than a law. A model cannot capture condition or renovation quality, which the MLS does not record consistently, so some of the gap may be picking up homes that were simply nicer inside. Views are not captured either. And neighborhood is controlled only coarsely: six named areas had enough sales to stand on their own and the remaining 118 are grouped together, so micro-location is reduced rather than eliminated. This is an adjusted association between single-level construction and price. It does not establish that the floor plan alone caused the difference.
One expectation the data overturned. After controlling for the other variables in the model, age had no detectable independent association with sale price in this sample. I went in assuming older homes would trade at a discount here. This trailing-year sample does not support that.
How competitive are Danville offers, and how should I think about contingencies?
Strong enough for that pocket, in that season. Which is a smaller number than most people arriving from the city expect.
Before my buyers decide how aggressive to be, I go get the actual picture: what homes in that pocket have been drawing this year. How many offers, how fast, whether they went over. "Danville is competitive" is true and useless. Then I call the listing agents and ask what they can appropriately share about the competing terms and the seller's priorities, which is often the difference between a strong offer and a winning one.
Here is what my own pull shows for the 200 other detached Danville homes that closed in the year to October 5, 2026:
- Median sale price $1,800,000, on a median 2,192 square feet and a 10,994-square-foot lot.
- Median sale-to-list ratio 100.0%. The typical home sold at asking.
- 42.5% sold over asking. The other 57.5% sold at or under.
- Median two offers. Of the 193 sales with a usable offer count: 41.5% drew exactly one, 49.7% drew two to four, and 8.8% drew five or more.
- Median 13 days on the market before going pending.
That offer distribution is the one that surprises people coming from San Francisco. Competition was common, since a majority of homes drew more than one offer. Five-way bidding wars were the exception.
Competition also varied a lot by period. One note on method: an offer's price is set the day it is accepted, not three weeks later when escrow closes, and the median gap between those two dates in this pull is 21 days. So these groups are organized by when each home went pending, not when it closed.
- Q4 2025 (Oct – Dec) — Sales: 50 · Sold over asking: 24.0% · Median days on market: 16 · Median sale-to-list: 98.01%
- Q1 2026 (Jan – Mar) — Sales: 55 · Sold over asking: 60.0% · Median days on market: 7 · Median sale-to-list: 100.52%
- Q2 2026 (Apr – Jun) — Sales: 37 · Sold over asking: 54.1% · Median days on market: 9 · Median sale-to-list: 100.07%
- Q3 2026 (Jul – Sep) — Sales: 48 · Sold over asking: 35.4% · Median days on market: 17 · Median sale-to-list: 99.06%
Put the two ends side by side. Of the 81 homes that went pending between February and June, 59.3% sold over asking at a median of eight days, and the median one closed at 100.52% of list. Of the 50 that went pending in the last quarter of 2025, 24.0% sold over asking, the median sat sixteen days, and the median one closed at 98.01% of list.
The two distributions are statistically different (Mann-Whitney p < 0.0001 across the 131 sales in these two groups). One caveat about that test, and it matters: I picked those two windows after looking at the quarterly results, because they were the two ends. That makes this an exploratory comparison rather than a pre-planned one, so read the p-value as a description of these two groups rather than a confirmed seasonal finding. For scale, the 2.5-point difference in median sale-to-list works out to about $45,000 on a $1.8 million list price, though the uncertainty is wide: the 95% bootstrap interval was approximately $12,000 to $79,000.
That is not money a comparable buyer would have saved by waiting. The two groups contained different homes and faced different inventory, different rates and different conditions.
What this does and does not establish. Two groups of homes, selling in two different periods, cleared at measurably different prices relative to asking. That is a period difference, not a seasonal law, and not evidence that the calendar caused it. And the most recent weeks are missing by construction: only five homes that went pending in September had closed by the cutoff.
Practically: in this sample, buyers entering the market in the first quarter met a faster, more competitive period, and that pattern may not repeat every year. What travels better than the calendar is readiness. Buyers with a lender, a budget and a few Saturdays of touring behind them can act on a listing when it appears; buyers still assembling those things cannot. Whether today's rates work for you is a conversation for your lender rather than for me.
So what about contingencies. Waiving one can make an offer more attractive to a seller, because it makes the deal simpler and more certain for them. It does that by moving risk onto you. The inspection, appraisal and loan contingencies each protect against a different problem, so the useful question is never whether a contingency can be waived. It is what you would actually do, and what financial exposure you would accept, if that specific protection were not there.
Which terms make sense depends on the property, the contract, your financing and what you are bidding against, so this is not something a blog post can answer for your house. My job is to explain every lever and pressure-test the consequences: walk me through what you would actually do if this specific thing turns up after you have waived it. "Are you comfortable waiving that" is too easy a question to say yes to.
I am the advisor. You are the decider. I back my clients a hundred percent whatever they decide, and it is their call.
Thinking about a move from San Francisco or the Peninsula? Send me the neighborhoods, price range and timing you are considering and I will show you what recent sales in that part of Danville actually looked like. Explore my Danville options →
What is the process like for moving from SF to Danville?
Expect your own list to change, and treat that as the process working rather than as indecision.
Most people moving out from the city understand the math before they arrive. What they do not have is a picture of which neighborhood fits. So the work is getting familiar: driving around, going to open houses, standing in kitchens, ruling places out because it did not fit or the freeway is too far.
A requirement I hear constantly is close to downtown and built after 1980. In Danville those two pull against each other, because the close-in neighborhoods were among the first built, so much of that stock is 1960s and 1970s. One of the two usually has to give, and which one gives is rarely clear on day one.
You are never going to find the house that hits every single thing on your list and is still in budget. People start with an idea of what they want, and as they see what different price points buy in different neighborhoods, their priorities shift. That shift is fine. A buy box is a starting position.
Proud to have been part of the 559 Old Orchard transaction, and happy to run this same analysis for whatever part of Danville you are looking at.
More answers: the relocation FAQ on this site covers the questions that come up most, and it is updated as the data changes.
Thinking about a move from San Francisco or the Peninsula to Danville? Send me the neighborhoods, price range and timing you are considering. I will show you what recent sales in that part of town actually looked like and help you work out the next useful step. Explore my Danville options →
Methodology
Every figure on this page comes from one dataset, and here is exactly what it is.
Source. My own MLS export for Danville, pulled October 6, 2026.
Criteria. Detached single-family homes. Status sold. Closing date from October 6, 2025 through October 5, 2026. Sale prices ran from $1,100,100 to $2,500,000.
Count. 200 peer sales, with 559 Old Orchard held out (see below). One one-story sale lacked an age value and is excluded from the regressions that require that field.
Offer counts — why the denominator is 193, not 200. Of the 200, four records are blank on the offer-count field and three more are coded 0. A closed sale cannot literally have received zero offers, so 0 is treated here as a missing-data code rather than a count. That leaves 193 sales with a usable offer count, and every offer-count percentage on this page is calculated on 193. The three zero-coded sales are genuine closed transactions; only their offer field is unusable.
The 559 Old Orchard holdout. 559 Old Orchard meets every criterion above and sits inside the pull. I hold it out of every figure by choice, because this page compares one transaction against an independent set of peers. That is a case-versus-peer design, not a statistical requirement and not an eligibility exclusion: including 559 would be perfectly valid and would move none of these figures materially at this sample size. So every number here describes 200 other qualifying Danville sales.
Sample ledger.
- Eligible transactions (detached, sold, in the window) — Count: 201
- Subject property held out (559 Old Orchard) — Count: 1
- Peer transactions behind the descriptive figures — Count: 200
- One-story / two-story / split or tri-level — Count: 119 / 70 / 11
- Complete records in the full regression — Count: 199
- Complete records in the one-story-versus-two-story regression — Count: 188 (118 and 70)
Period grouping. Sale-to-list ratio and offer count are determined when an offer is accepted, so period comparisons use the MLS off-market date rather than the closing date. The median gap between the two in this pull is 21 days. Trailing-year totals use closing date.
The single-story estimate comes from an ordinary-least-squares regression of the log of sale price on the logs of both square footage and lot size, plus age, bedrooms, bathrooms, a private pool, garage spaces, neighborhood and the quarter the offer was accepted. Standard errors are heteroskedasticity-robust (HC3). The headline figure restricts the comparison to one-story against two-story homes only, so the eleven split-level and tri-level sales are not mixed into the comparison group. Reported effects are exp(coefficient) minus one, not the raw coefficient.
- Primary (one-story vs two-story, n=188) — Estimate: +9.2% · 95% CI: +3.9% to +14.7% · p: 0.0005
- Huber M-estimator (down-weights outliers) — Estimate: +8.5% · 95% CI: +3.9% to +13.2% · p: 0.0002
- Tukey biweight — Estimate: +8.5% · 95% CI: +3.8% to +13.4% · p: 0.0003
- Deleting the 16 observations flagged as influential by Cook's distance — Estimate: +6.4% · 95% CI: +1.5% to +11.4% · p: 0.0092
- Trimming sq ft to the 5th–95th percentile — Estimate: +8.9% · p: 0.0020
- Trimming price to the 5th–95th percentile — Estimate: +8.2% · p: 0.0024
- Without neighborhood controls — Estimate: +9.7% · p: 0.0004
The 6.4% figure is a point estimate from a smaller sample, not the lower end of the confidence interval. Split-level and tri-level sales showed no detected difference from two-story once adjusted (+2.9%, p=0.52), on only eleven observations — too few to conclude they perform the same.
The period comparison was tested on the two sale-to-list distributions directly: Mann-Whitney U, p = 3.6 × 10⁻⁵ (Welch p = 0.0036, Kolmogorov-Smirnov p = 0.00014), with a bootstrap 95% interval on the median difference of 0.68 to 4.41 percentage points. This is an exploratory comparison. The February–June and Q4 2025 windows were selected after the quarterly results were inspected, because they were the two extremes, so the p-value describes these groups rather than confirming a seasonal effect. A confirmatory test would need windows defined in advance and more than one year of data.
Known limits. One year, one town. MLS records do not consistently capture condition or renovation quality, which no model here controls for. Homes that went pending in the last few weeks of the window had not closed by the cutoff and are therefore absent. Any individual home can sit far from these medians, and nothing here values or prices an offer on a specific property.
Frequently asked questions
- Is Danville walkable?
- Parts of it genuinely are, and it depends what you mean. Walking to downtown is realistic from Westside Danville, Woodbine, Diablo West, Sycamore, Leander Hills, El Pintado, Las Lomitas, Woodmont and Camino Verde. Walking for its own sake, a loop with a dog or a stroller, works in far more of the town, including Anderson Ranch off Camino Tassajara and anywhere with access to the Iron Horse Trail.
- How long is the walk to downtown Danville from Woodbine?
- About 15 minutes, using the shortcut bridge onto Diablo Road. From Greenbrook or Danville Station along the Iron Horse Trail it is closer to 35 to 40 minutes.
- How many offers do Danville homes get?
- Among the 193 of 200 peer sales with a usable offer count, the median was two offers. Of those 193, 41.5% received one offer, 49.7% received two to four, and 8.8% received five or more. (Four records are blank on that field and three are coded zero, which cannot be a real count for a closed sale.) Source: Jens Hansen's MLS export, Danville, pulled October 6, 2026, covering closings in the year to October 5, 2026.
- Do single-story homes cost more in Danville?
- On this dataset, yes. The primary adjusted estimate was 9.2%, with a 95% confidence interval of 3.9% to 14.7%, holding size, lot, age, bedrooms, bathrooms, pool, garage, neighborhood and timing constant. Robust estimators produced 8.5%, while deleting sixteen influential but valid sales produced 6.4%. The positive association was consistent, but its precise size remains uncertain. One year of local data, and no model here can control for condition or renovation quality, so read it as an adjusted association rather than a proven cause.
- Was there a better time of year to buy in Danville?
- Within this one year, the two ends of the calendar looked different. Of the 81 homes that went pending February through June 2026, 59.3% sold over asking at a median of eight days. Of the 50 that went pending October through December 2025, 24.0% did, at a median of sixteen days. That is a difference between two periods, not proof that the season caused it. The comparison uses Q4 2025; Q4 2026 was not yet observable at the October 5 cutoff.